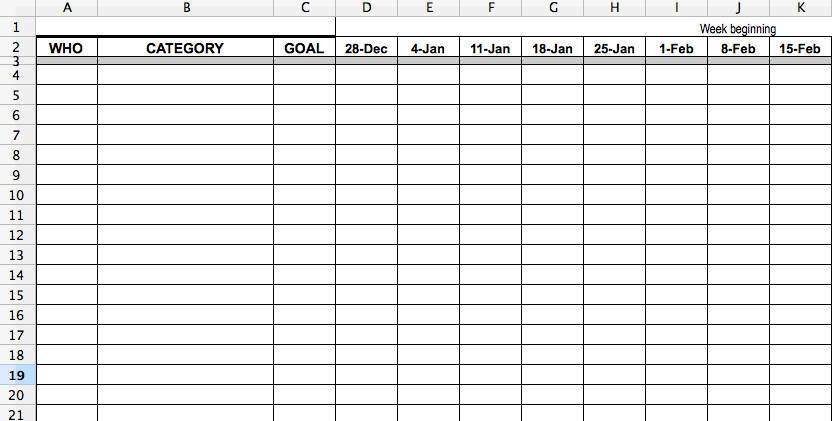
 The scorecard is one of the foundational tools we teach our EOS clients. When I explain that it is a tool to enable management by exception, many of my clients respond that they do that already with a dashboard they keep.
One of the key differences between scorecards and dashboards is that typically, not always, dashboards focus on outcomes at a point in time. How many dollars or deals are in our sales pipeline? How many customer complaints are in our customer service queue. How much cash do we have? What are our days sales outstanding? They are all important, but they have one shortcoming,- when you see them, the time to react to them is past.
Scorecard items, as defined by EOS, are forward looking, activity based numbers, with weekly goals, which lead to desired outcomes. A classic example of this is achieved by documenting the activities in the sales pipeline which move a suspect through the pipeline to prospect, hot prospect and finally to customer. Items like qualification calls, requirement assessment meetings, capabilities presentations, and quotations are examples of scorecard activities.
Scorecards can, and should, be kept in every department. Engineering and software development projects have similar milestones. Documenting activities around AR and AP in finance should be straightforward. Manufacturing flow through a shop can be described in activities as well. You get the picture.
There are three clear benefits accrued by using scorecards in every department,-
- Perfect clarity for individuals as to what management expects of them (this works between management levels as well),
- People begin to self manage, which frees up management to focus on future opportunities and challenges, and
- If activities get off track, you have the opportunity to get them back on track before the quarter ends, rather than doubling up in the next quarter.
If this could be helpful for your company, please download a free copy of the scorecard shown in the graphic in this post here.


