 Throughout the US, we have been fascinated by 2014 FIFA World Cup over the past couple of weeks. Like so many others, I was rooting for the US, hoping against hope that they could pull off the impossible and beat Belgium in the Round of 16.
I was unable to watch the game on television and was limited to periodically checking Google from time-to-time. By halftime the statistics were woefully out of favor for Team USA. Belgium had a 4 to 1 advantage on corner kicks, a 2.5 to 1 margin for attempts close to the goal and a 3 to 1 shots on goal edge.
Incredibly, at the end of regulation the score was tied 0-0. By the score, you would think that it had been a relatively even match, but nothing could be further from the truth. Tim Howard, the USA goalie, had played the game of his life, making the most saves by a goalkeeper in the last 50 years of World Cup play.
Before the tournament, Jurgen Klinsmann, the US coach, made it clear he knew our chances were slim to none that we would win the World Cup because we did not have the talent:
We cannot win this World Cup, because we are not at that level yet. For us, we have to play the game of our lives seven times to win the tournament.
Tim Howard played the game of his life. He was recently affectionately crowned the “US Secretary of Defense” on Wikipedia, but ultimately the odds were too steep. In the end, the data did not lie.
The measurables that my clients use to monitor their progress predict similar wins and losses in their future.
How are World Cup match stats related to scale up business success?
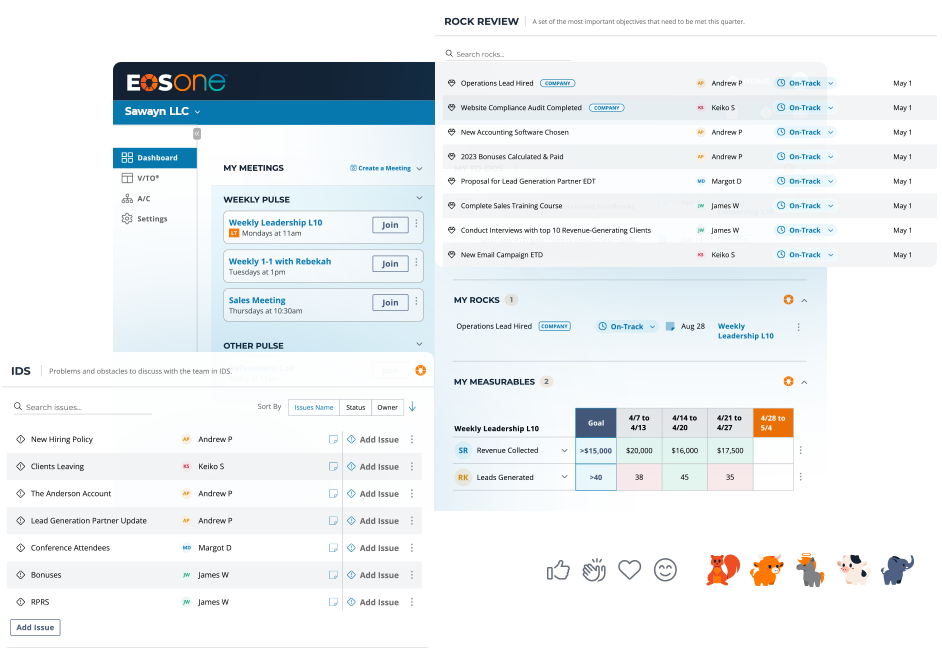
In the same way I monitored stats during the match, I have my clients check-in weekly on 5 to 15 measurables from their scorecards as part of the Data Component of the EOS (Entrepreneurial Operating System). The scorecard is a handful of weekly, leading indicators that helps teams at every level of the organization keep an absolute pulse on their business. Displayed in a simple spreadsheet that includes thirteen weeks of history, a great scorecard clearly identifies patterns and trends that lead to real insight and better, faster decision-making. In this way, companies can decide what changes need to be made to create the best chance for success.
When Googling the match stats, I had all of the numbers I needed to predict the final outcome. We may have had our hopes up for the “miracle on the pitch’ ala ‘the Miracle on Ice,’” but the data does not lie. In the same way that the match stats predicted the USA’s ultimate defeat, you can build a scorecard and monitor the measurables that can provide the leg up you need to achieve breakthrough growth.
- What are the measurables needed to determine your businesses success?
- Is your business targeting and adjusting midstream to achieve its goal effectively?
- Would you like to have more control of your business?
Let us know if you would like to discuss how we can help you and your business be its best.


